Housing and Home ownership in Ireland
Information on the general state of the housing market in Ireland, Dec, 2019
Home Ownership
How does Ireland compare to other european nations in terms of home ownership? The table below shows Ireland as slightly above the EU average but still inline with our western european neighbours. The suggestion that we are a nation obsessed with home ownership doesn't seem to tally with the figures. In fact, in a list of home owners as a percentage of population, Ireland and much of western europe are far down the list. Countries above us include; Romania 96%, Poland 84%, Latvia 81%, Norway 81%, Spain 76%.
(Figures from tradingeconomics.com)
| Country | Percentage |
|---|---|
| EU Average | 69.30% |
| Ireland | 69.50% |
| UK | 65% |
| France | 64.40% |
| Germany | 51.40% |
| Netherlands | 69.00% |
House price figures for Ireland
Ireland in 2018 had seen the second highest rate of growth in house prices in the EU at 10.2%, just behind Portugal on 10.3%. This is more than twice the EU average of 4.4%. (Although the price of Portuguese property is rising rapidly, it remains a relatively inexpensive place to buy a home. Ireland, on the other hand, remains an expensive.)
(Figures according to Daft.ie, Jan 2019)
| Location | Average Price | ||
|---|---|---|---|
| Average house price nationwide: | €263,000 | ||
| Dublin city centre region: | €375,862 | ||
| Dublin county region: | €388,135 | ||
| Cork | €253,033 | – up 9.3% on 2017 | |
| Cork city: | €285,941 | - up 4.4% on last year | |
| Galway: | €205,400 | – up 1.7% on last year | |
| Galway city: | €305,549 | €100,000 higher on last year |
Figures from Daft.ie 2019 report.
Annual Increase in housing stock
In his book Free Lunch, Easily Digestible Economics David Smith explains about the British housing stock:
"When we talk about the housing market, we are talking by and large about a second-hand market. New houses are built every year but their number is tiny, perhaps a 1 percent increase in supply in relation to the existing housing stock. The net addition to that stock each year, taking into account properties removed from the market by demolition or conversion into offices, is even smaller."
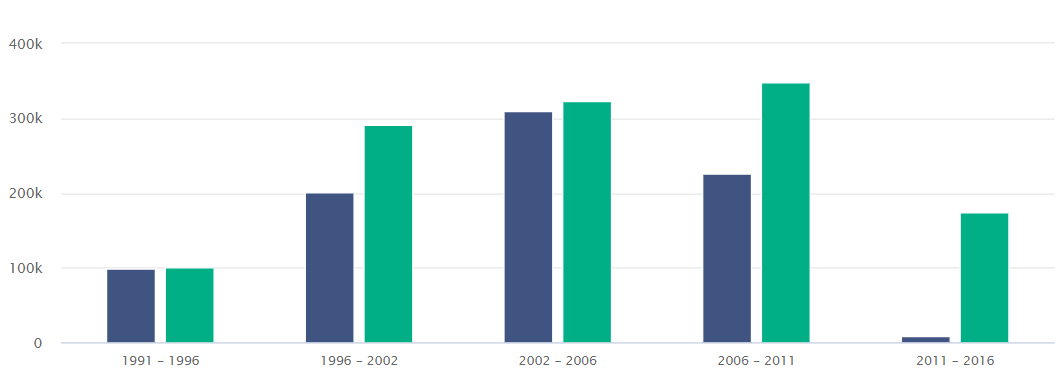
After the 2008 housing bubble construction on new housing virtually collapsed, many housing developments were left uncomplete or unsold. Many tradesmen employed in the industry left and never returned. Looking at the chart below we can see the consequence of this, from the period 2011 - 2016 there was an increase in stock of only 8,800 against an increase in population of 173,613.
The chart below shows the increase in housing stock (Dark Blue), against the population increase (green). Further information can be found at the CSO website: https://www.cso.ie/en/releasesandpublications/ep/p-cp1hii/cp1hii/hs/
New Dwelling Completions
According to CSO figures, new dwelling completions were up 25% in 2018 compared to 2017, with a total of 18,072. So are we seeing some recovery? In an article for the Irish Times 'How many houses do we really need?'(Jun 2018) John McCarthy, director of research at Savills suggested what he believed would be the number needed to meet demand:
"Moving to demand, most analysts (including myself) believe that, in the medium term, 30,000-35,000 dwellings are needed each year to cover population growth, changing household sizes, obsolescence and some ‘over-building’ to offset previous under-construction. However factors such as net migration are inherently tricky to forecast and a minority of industry commentators say demand is greater - up to 53,000 units per annum."
Hostorically speaking, net migration has always been underestimated. If the analysts on the greater estimate are correct, we are looking at a shortfall in 2018 of 35,000 units. Construction of new units will have to double just to meet demand next year.
CSO figures on new dwellings 2017 - 2018
| Period | Single | Scheme | Apartment | Totals |
|---|---|---|---|---|
| 2017 | 4,264 | 7,916 | 2,227 | 14,407 |
| 2018 | 4,699 | 11,001 | 2,372 | 18,072 |
| % Change | 10.2 | 39.0 | 6.5 | 25.4 |
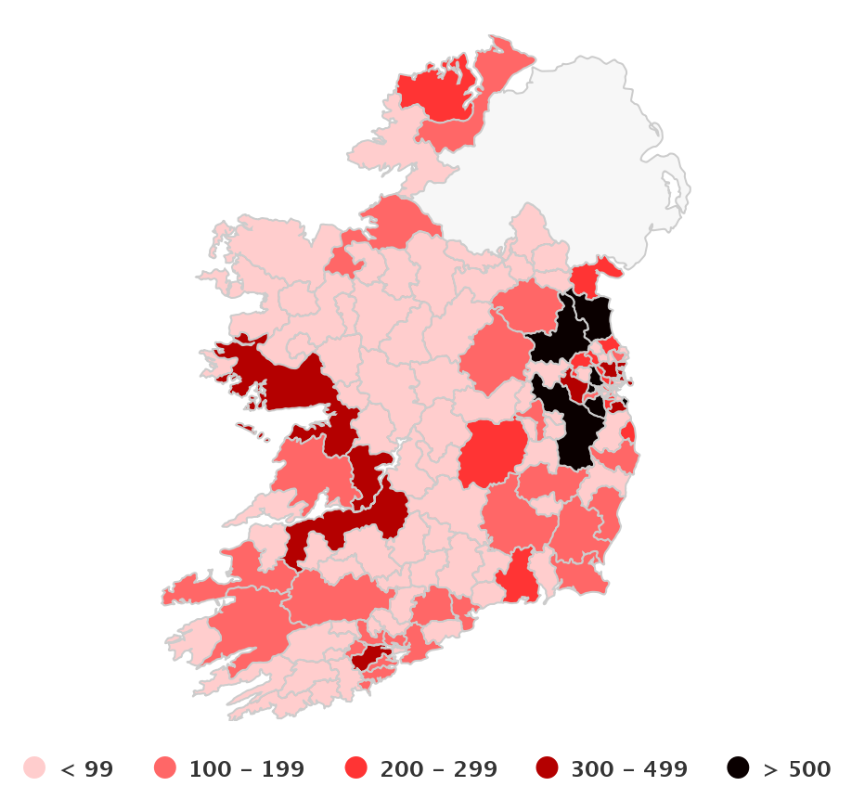
The map below shows the distribution of the new dwellings built in 2018. As prices in and around Dublin increase people have been forced further out in the commuter belt.
Why house prices rise
After the 2008 housing crash, new central bank rules were introduced on mortgage lending in an effort to curb the kind of lending that had taken place prior to the crash. In short, the new rules consisted of:
Loan-to-income limit (LTI) general limit of 3.5 times gross annual income and
Loan-to-value limit (LTV) a first-time buyer will need a deposit of 10% for any house or apartment. Non-first-time home-buyers, there is a limit of 80% of LTV, so a deposit of 20% of the total purchase price needed. For properties other than principal dwelling homes, including buy-to-let properties, a limit of 70% LTV applies
The new rules have no doubt helped reign in the kind of house price inflation we had seen prior to the crash. The unintended consequence of this has been the massive inflation of rents as more and more people cannot get onto the housing market.
To explain house price inflation I'll refer again to the book mentioned above by David Smith. In one of the chapters he explains the rise of house prices. It should be noted that he is discussing the economics of house price increases in relation to the British housing market.
"One of the most enduring economic relationships is that between house prices and people’s incomes. House prices rise because incomes do. The house price/earnings ratio – the ratio of average house prices to national average earnings for full-time workers – is around 3.5 over the long run, usually fluctuating between three and four. If average earnings are £20,000 a year, average house prices will be around £70,000. It is easy to see why this relationship should exist. Suppose house prices had not risen and were stuck at their 1930s level. Someone on average earnings could buy several houses in the London suburbs a year, instead of buying one and paying for it over the twenty-five years of a mortgage. We are back to supply and demand. In this case rising demand does not mean that everybody wants to own a string of houses. It does mean the amount they can afford to pay for their semi has increased hugely and, more importantly, so has the amount others can afford to pay. Competition among buyers, all of whom have been able to pay more over time, pulls house prices higher."
"Rising incomes pull house prices higher and incomes have risen steadily, and by about 2 percent a year more than inflation (in other words in ‘real’ terms) for as long as anybody can remember. If we go back forty years, average earnings were a few hundred pounds a year."
"There is also an institutional element in the relationship between house prices and incomes. Banks and building societies base their mortgage-lending decisions on the income, and therefore ability to pay, of the borrower, offering an advance that is a multiple of annual salary. That multiple can be as high as four, five or six times the salary, although the average is only just over two. Interestingly, the ratio of house prices to incomes is usually significantly higher for older people, who have been homeowners longer, than for first-time buyers. This is because, while for first-time buyers the mortgage covers a high proportion of the value of the property, longer-term homeowners have usually built up capital, or ‘equity’, in their house. Someone buying a £25,000 house on a £20,000 mortgage has £5,000 of equity. If the value of the house rises to £100,000, the amount of equity increases to £80,000. There is, incidentally, little evidence that the housing market has become progressively more difficult for first-time buyers to enter, particularly when the level of interest rates is taken into account, of which more below. Indeed, the opposite may be true. In the past – until the early 1980s – when mortgage lending was limited to the building societies and rationing was common (societies had to have enough income from savers to lend out in mortgages), entering the market was a long and tortuous process."
"Why do house-builders not respond to high prices by flooding the market with new houses? And why does this not bring prices down, as it would for other products? The answer is that new houses account each year for only a tiny proportion of the existing housing stock. Land, to go back to some of those definitions at the start of this chapter, is a scarce resource. And planners ensure that, as far as building is concerned, it remains so. If there were no planning restrictions and any farmer could sell a few fields for housebuilding, the housing market would be more like the market for potatoes. Big increases in supply would, from time to time, be followed by significant price falls. The planners, by preventing this from happening, help ensure rising house prices. It is possible to stretch available living space a little, by converting houses into flats, or offices and former factories into fashionable lofts. But the general point still holds. New supply is very small in relation to the size of the market. To economists supply is ‘inelastic’ – it responds only slowly to rising prices."
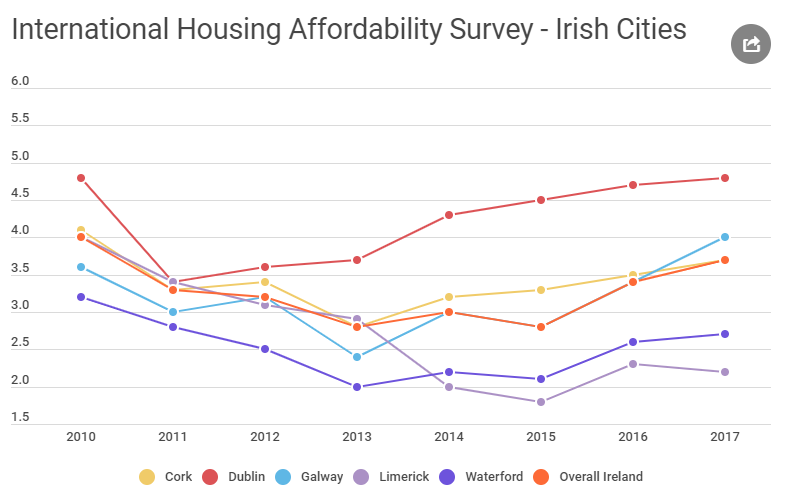
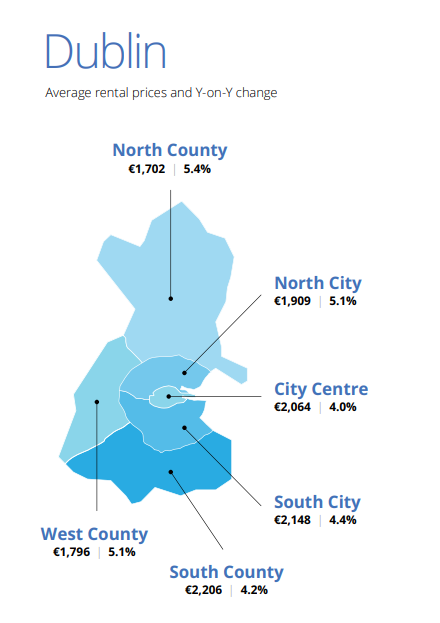
So how true is the above in the Irish case? Are Irish house prices in line with our earnings? A study by the Demographia International Housing Affordability Survey which indexes middle-income housing affordability using the "Median Multiple" which is the median house price divided by the median household income, has Ireland as a whole listed as 3.7 placing it in the 'Moderately Unaffordable' category. This index rates “affordable” as 3.0 and under, up to a “severely unaffordable” measure of 5.0. Dublin as shown below is coming very close to the "severly unaffordable" category. Interestingly the most unaffordable place for workers to live (in the cities part of the study) came out as Sydney Australia, which had a score or 12.9!
The rental market
Due to the high rent inflation in Ireland the government in Dec 2016 introduced Rent Pressure Zones. Essentially the bill introduced an annual cap on increases of rent to 4% in certain pressure areas. Rents in Dublin as a whole have risen from the low point in mid-2011 by 101%.
A rent pressure zone is an area where annual rent increases have been at 7% or more in four of the last six quarters and where the rent levels are already above the national average and in these areas, rent increases will be capped at 4% per annum over a three- year period.
The Rent Pressure Zones include the following areas:
- Dublin:
- - Dublin City, Dun Laoghaire-Rathdown, Fingal and South Dublin County Council)
- Cork:
- - Cork City Council local authority area, Douglas, Ballincollig, Carrigaline, Passage West, Cobh
- Meath:
- - Slane, Julianstown, Duleek, Laytown, Bettystown, Ashbourne, Dunboyne, Dunshaughlin, Ratoath and Navan
- Kildare:
- - Naas, Sallins, Celbridge, Leixlip, Rathangan, Kildare, Newbridge, Maynooth
- Wicklow:
- - Bray, Enniskerry, Wicklow
- Galway City
- Louth:
- - Drogheda
- Wicklow:
- - Greystones
- Limerick:
- - Limerick City East
The full list can be found at https://www.threshold.ie/advice/dealing-with-problems-during-your-tenancy/am-i-renting-in-a-rent-pressure-zone/
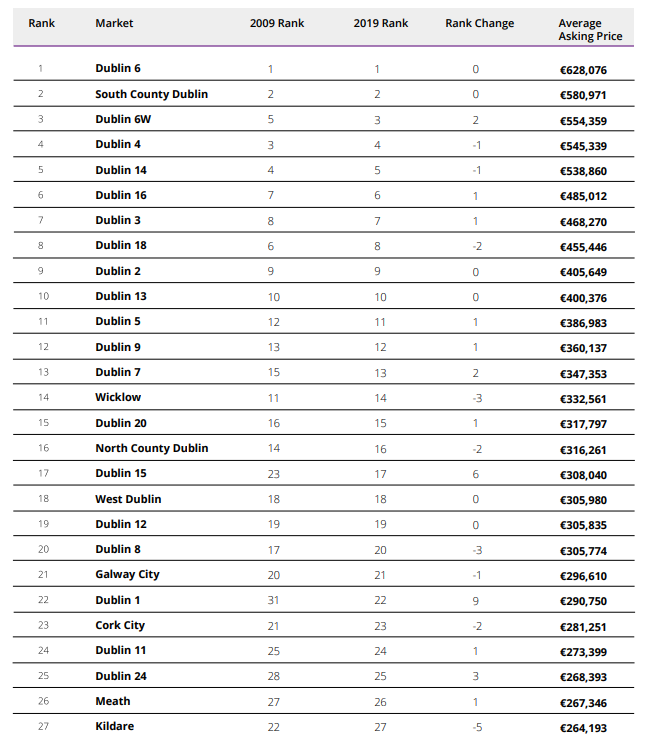
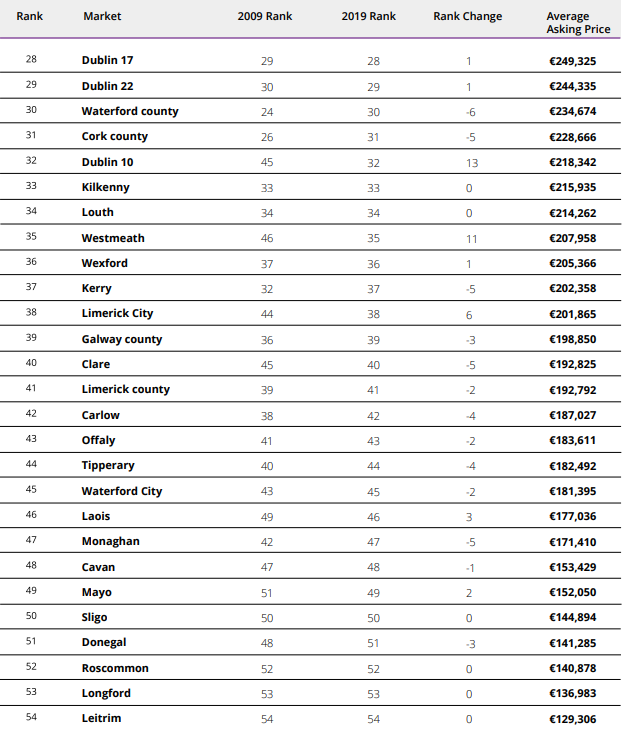
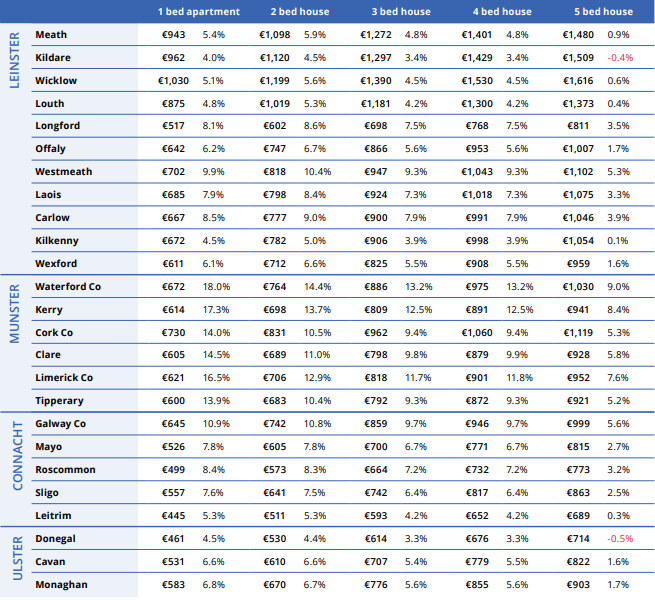
According to a report from Daft.ie (2019) the average monthly rent nationwide is at €1,391. Figures for the average rent across counties can be seen in the image below.
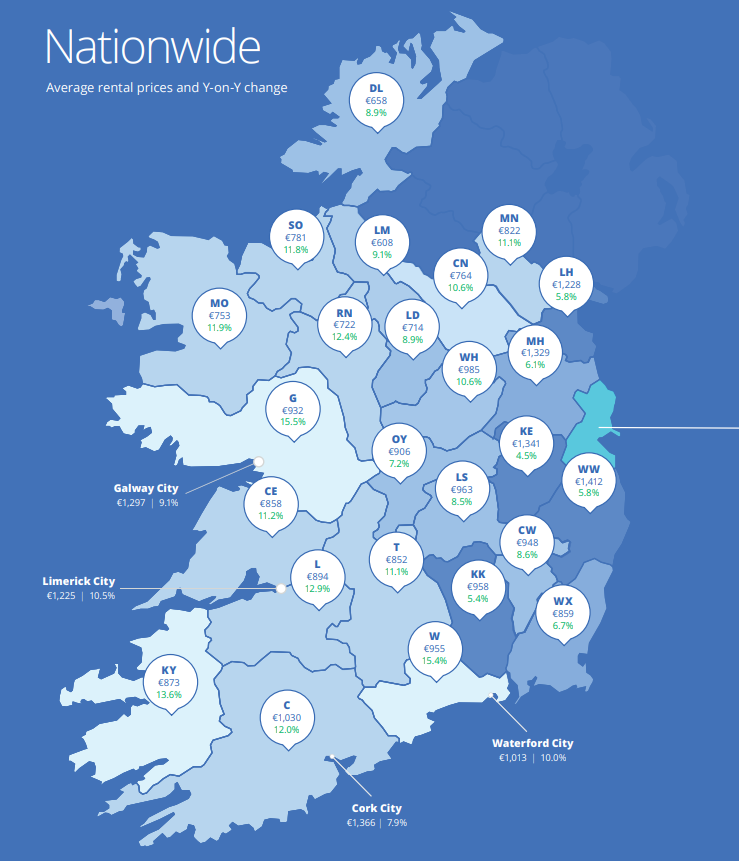
The report goes on to state that rent inflation has fallen in 2019:
Fall in number of markets with double-digit inflation Over the last year, the rate of rental inflation has roughly halved, from a high of 12.4% in mid-2018 to 6.7% in mid-2019. While rents are still rising in each of the 54 markets covered in the Daft.ie Report, the number of markets exhibiting double-digit inflation (i.e. a rate above 10% year-on-year) has fallen from 41 of the 54 markets a year ago to sixteen markets currently. Inflation is highest in Galway county (15.5%) and lowest in Dublin 2 (at just 2.3%)
In the Daft.ie report Ronan Lyons, Assistant Professor in Economics TCD, has the following comments on the Build to Rental developments
"Overall, there are roughly 25,000 new BTR rental homes being planned or built currently, with some completing as early as this year, while others are still in pre-planning stages. "
"This total compares with an estimated shortfall of closer to 70,000 rental homes in Dublin, in the last Daft.ie Rental Report. The numbers suggest that the period 2019-2023 is likely to see a 20% increase in the stock of rental homes across the two cities. This translates into an annual growth rate of 3.7% for those five years..."
The full report can be found here: https://www.daft.ie/report/2019-Q2-rental-daftreport.pdf
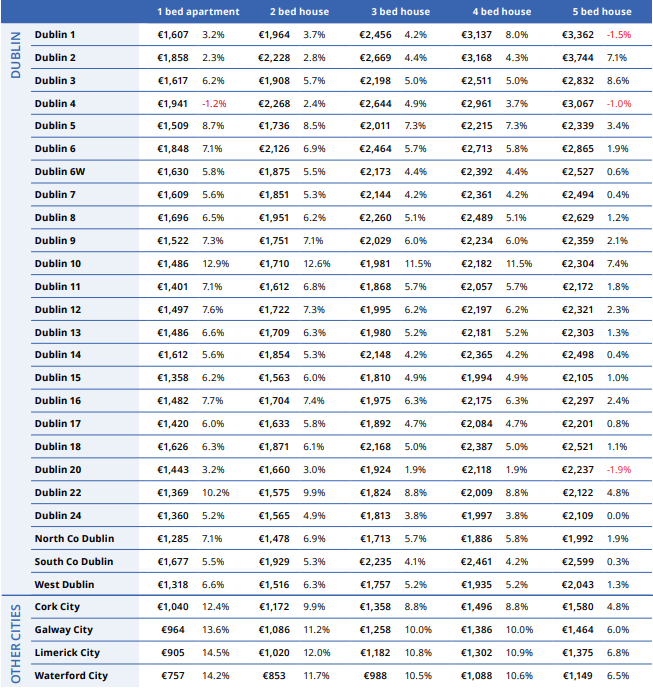
Renting Vs. Buying
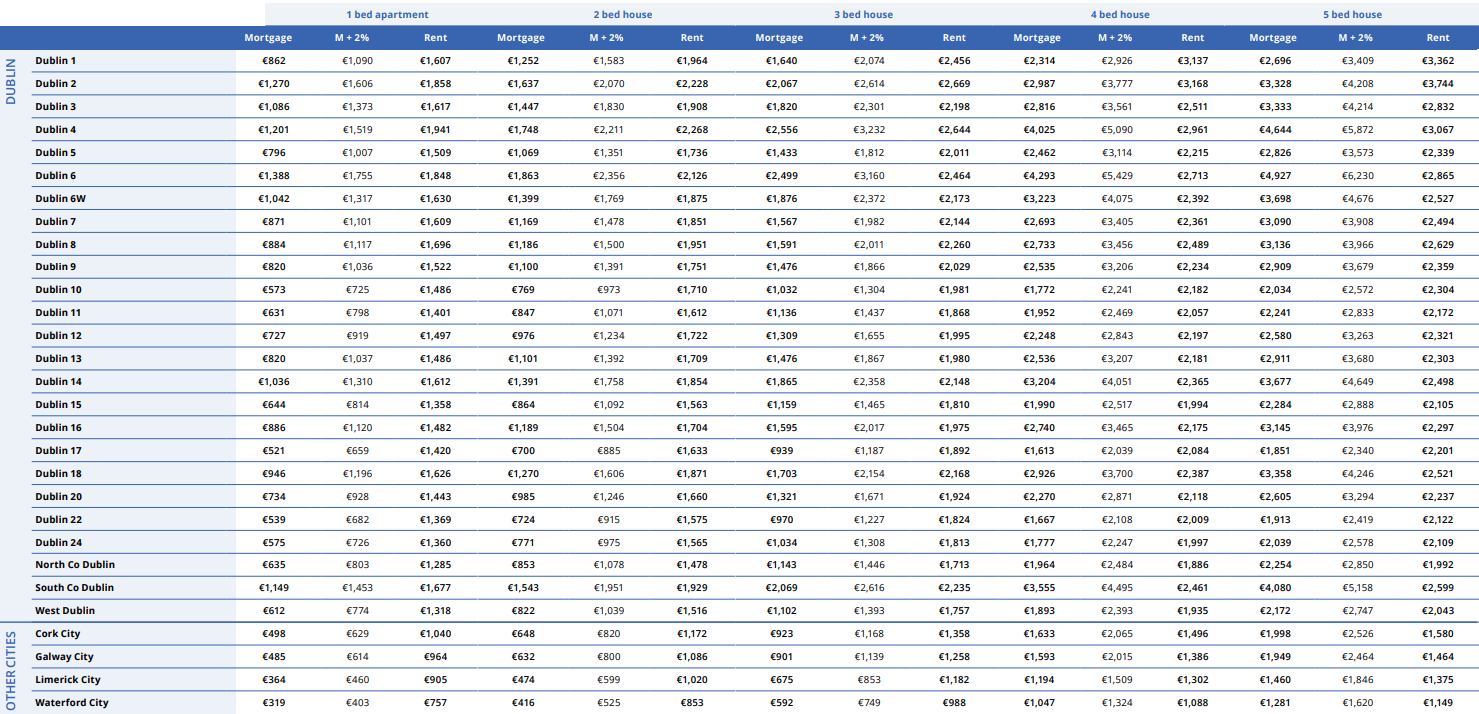
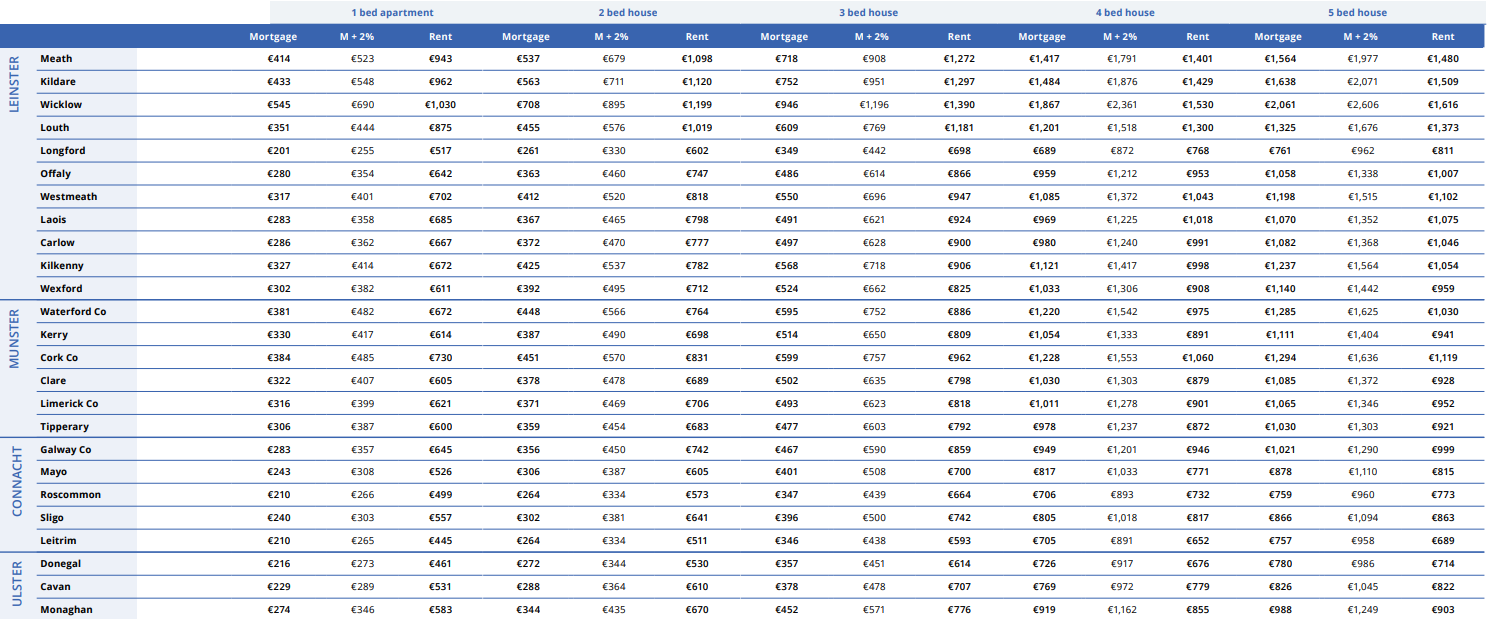
Rent Vs Buying
Comparison of cost for monthly Mortgage against Rent by location for 1 Bed(Columns 2-4) and 2 Bed(columns 5-7) properties
| Location | Mortgage | M + 2% | Rent | Mortgage | M + 2% | Rent |
|---|---|---|---|---|---|---|
| Dublin 1 | €862 | €1,090 | €1,607 | €1,252 | €1,583 | €1,964 |
| Dublin 2 | €1,270 | €1,606 | €1,858 | €1,637 | €2,070 | €2,228 |
| Dublin 3 | €1,086 | €1,373 | €1,617 | €1,447 | €1,830 | €1,908 |
| Dublin 4 | €1,201 | €1,519 | €1,941 | €1,748 | €2,211 | €2,268 |
| Dublin 5 | €796 | €1,007 | €1,509 | €1,069 | €1,351 | €1,736 |
| Dublin 6 | €1,388 | €1,755 | €1,848 | €1,863 | €2,356 | €2,126 |
| Dublin 6W | €1,042 | €1,317 | €1,630 | €1,399 | €1,769 | €1,875 |
| Dublin 7 | €871 | €1,101 | €1,609 | €1,169 | €1,478 | €1,851 |
| Dublin 8 | €884 | €1,117 | €1,696 | €1,186 | €1,500 | €1,951 |
| Dublin 9 | €820 | €1,036 | €1,522 | €1,100 | €1,391 | €1,751 |
| Dublin 10 | €573 | €725 | €1,486 | €769 | €973 | €1,710 |
| Dublin 11 | €631 | €798 | €1,401 | €847 | €1,071 | €1,612 |
| Dublin 12 | €727 | €919 | €1,497 | €976 | €1,234 | €1,722 |
| Dublin 13 | €820 | €1,037 | €1,486 | €1,101 | €1,392 | €1,709 |
| Dublin 14 | €1,036 | €1,310 | €1,612 | €1,391 | €1,758 | €1,854 |
| Dublin 15 | €644 | €814 | €1,358 | €864 | €1,092 | €1,563 |
| Dublin 16 | €886 | €1,120 | €1,482 | €1,189 | €1,504 | €1,704 |
| Dublin 17 | €521 | €659 | €1,420 | €700 | €885 | €1,633 |
| Dublin 18 | €946 | €1,196 | €1,626 | €1,270 | €1,606 | €1,871 |
| Dublin 20 | €734 | €928 | €1,443 | €985 | €1,246 | €1,660 |
| Dublin 22 | €539 | €682 | €1,369 | €724 | €915 | €1,575 |
| Dublin 24 | €575 | €726 | €1,360 | €771 | €975 | €1,565 |
| North Co Dublin | €635 | €803 | €1,285 | €853 | €1,078 | €1,478 |
| South Co Dublin | €1,149 | €1,453 | €1,677 | €1,543 | €1,951 | €1,929 |
| West Dublin | €612 | €774 | €1,318 | €822 | €1,039 | €1,516 |
| Cork City | €498 | €629 | €1,040 | €648 | €820 | €1,172 |
| Galway City | €485 | €614 | €964 | €632 | €800 | €1,086 |
| Limerick City | €364 | €460 | €905 | €474 | €599 | €1,020 |
| Waterford City | €319 | €403 | €757 | €416 | €525 | €853 |
| Meath | €414 | €523 | €943 | €537 | €679 | €1,098 |
| Kildare | €433 | €548 | €962 | €563 | €711 | €1,120 |
| Wicklow | €545 | €690 | €1,030 | €708 | €895 | €1,199 |
| Louth | €351 | €444 | €875 | €455 | €576 | €1,019 |
| Longford | €201 | €255 | €517 | €261 | €330 | €602 |
| Offaly | €280 | €354 | €642 | €363 | €460 | €747 |
| Westmeath | €317 | €401 | €702 | €412 | €520 | €818 |
| Laois | €283 | €358 | €685 | €367 | €465 | €798 |
| Carlow | €286 | €362 | €667 | €372 | €470 | €777 |
| Kilkenny | €327 | €414 | €672 | €425 | €537 | €782 |
| Wexford | €302 | €382 | €611 | €392 | €495 | €712 |
| Waterford Co | €381 | €482 | €672 | €448 | €566 | €764 |
| Kerry | €330 | €417 | €614 | €387 | €490 | €698 |
| Cork Co | €384 | €485 | €730 | €451 | €570 | €831 |
| Clare | €322 | €407 | €605 | €378 | €478 | €689 |
| Limerick Co | €316 | €399 | €621 | €371 | €469 | €706 |
| Tipperary | €306 | €387 | €600 | €359 | €454 | €683 |
| Galway Co | €283 | €357 | €645 | €356 | €450 | €742 |
| Mayo | €243 | €308 | €526 | €306 | €387 | €605 |
| Roscommon | €210 | €266 | €499 | €264 | €334 | €573 |
| Sligo | €240 | €303 | €557 | €302 | €381 | €641 |
| Leitrim | €210 | €265 | €445 | €264 | €334 | €511 |
| Donegal | €216 | €273 | €461 | €272 | €344 | €530 |
| Cavan | €229 | €289 | €531 | €288 | €364 | €610 |
| Monaghan | €274 | €346 | €583 | €344 | €435 | €670 |